Wednesday, September 9, 2015

Solar power at a critical mass

I've been reading science news, and I noticed that photovoltaic systems are rapidly becoming cheaper, and new PV solar power plants are constantly being built all over the world. This seems to be mostly the effect of pure economics - solar power is becoming competitive with coal/gas in many areas - than from governmental incentives or environmental considerations. From Wikipedia, we have a plot of PV cost vs year, showing a "Moore's Law"-type decrease every year, which is apparently called "Swanson's Law":
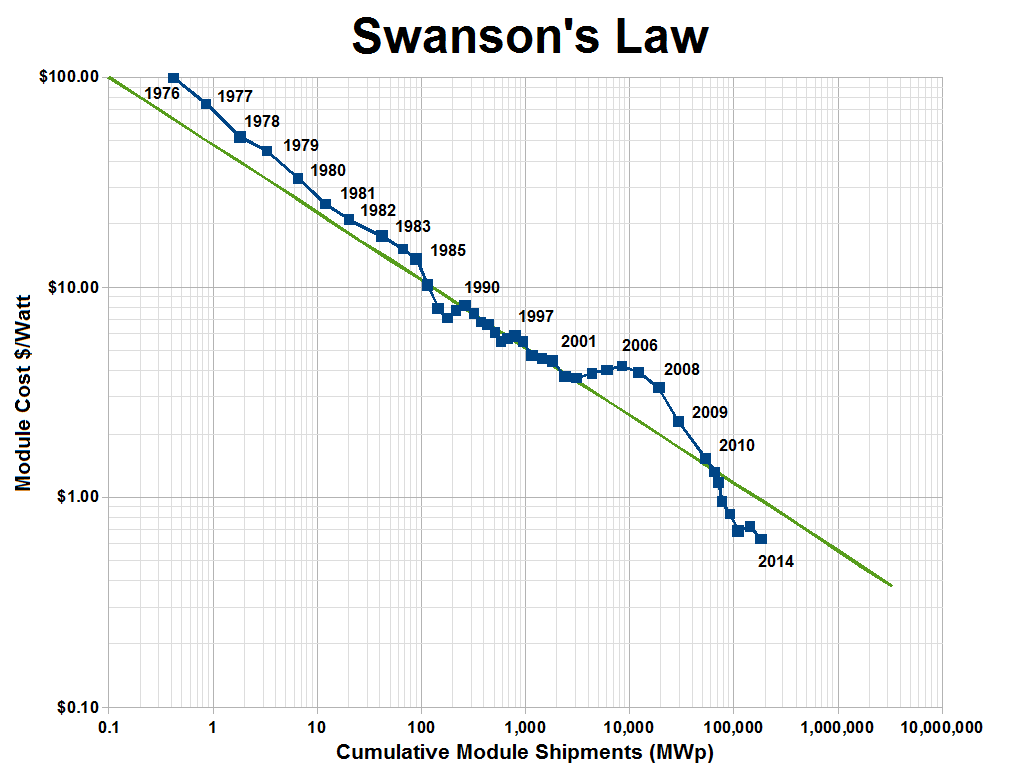
I'm not sure who tried to make that green line fit with the blue data but it doesn't look like a good fit. It seems like the cost is decreasing even faster than the original estimate of being cut in half every ten years. So how has that affected the total installed solar power capacity?

You can see that installed PV capacity, as a share of global electricity capacity, is increasing exponentially for now (sigmoidally once it has a significant percentage). My (very) simple and optimistic model predicts that half of all global electricity will be solar power by 2025. Ten years is a very short amount of time to go from less than 1% to more than 50%, so I would take this prediction with a big grain of salt. Some reasons why this model may be way off:

  1. People are installing PV in the sunniest places with the highest energy costs, basically going after the lowest-hanging fruit. Once those places are saturated with PV, it'll be harder to convince people in cloudier places and with abundant fossil fuels to start investing in solar power. I'm sure there's an economic model of this phenomenon somewhere, but for now I'll defer to this headache-inducing technology adoption curve, which shows how disruptive technologies like electricity, refrigerators, clothes washers, autos, ACs, and internets are adopted over time. The main difference between these appliances/services and solar power is, anyone can install a few solar panels and sell electricity to their neighbors, but you can't easily opt-out of using solar electricity if your neighbor or utility company is providing that.
  2. Economies of scale get tricky here. On the one hand, as we study this system and build more of these things, we get better and more efficient at doing it, making the process cheaper per panel. On the other hand, building a lot of these panels will start to impact the availability of raw materials necessary for them, like tellurium (required for a certain type of PV) or lithium (required to store the energy from PV until people want to use it).
  3. Sunlight only shines during the day, and more in the summer than the winter. So once a certain area has enough PV to provide all daytime electricity demand, it won't be very useful to add any more PV unless there's some way to store that energy (like with batteries).
  4. There's a large up-front cost for making changes, like shifting from coal to solar power. Your state might save $20M per year by building a solar power plant, but if you don't have the $100M to build it, and you do still have a fully operational coal power plant, then which one are you going to use? 
  5. One huge source of carbon emissions that isn't included in the above chart is transportation fuels, primarily oil. Once electric cars have a comparable range to combustion cars, then cheap solar electricity may cause a widespread shift to electric vehicles. This might increase demand, but would also allow for that demand to be more flexible: You plug your car in when you arrive home, and you tell its nightrider-style computer, "buy electricity whenever it's cheapest, but make sure I have at least 50 miles of range by tomorrow morning". All the cars in your area will be doing the same thing, so when demand spikes or supply drops, they'll all pause, but when supply spikes or demand drops, they'll all start slurping those precious Amps. This will serve to help demand adapt to fit supply, keep the prices relatively steady, and keep electricity availability more stable. On top of that, those cars might further be programmed to "buy low and sell high", automatically selling energy back to the grid when it's expensive, earning their owners a few extra dollars a month, and further contorting electricity demand to more closely fit supply.
  6. My sigmoidal model assumes that, eventually, all electricity will be made with solar power, but that's clearly not going to happen. For many cities and countries, it won't make sense to shut down their perfectly-good coal/nuclear/whatever plant until it breaks down. So I recalculated my fit to assume that solar power will only ever hit 60% of global electricity production, and the prediction is only delayed by three years: half of all electricity will be solar power by 2028. A quick note on the math here: since, as you can see in the semilog plot above, electricity has not left the "exponential" phase of the sigmoid shape - in other words, because it's so early and it only accounts for 0.9% of global supply - it's hard to predict where it will level off. I can get my model to fit with a correlation coefficient of 0.99 with a predicted maximum PV saturation as low as 3% of global supply. But we will know the answers within the next 5-10 years.

Case Study: Hawaii

Let's look a little closer at Hawaii, where expensive diesel-powered electricity and sunny days combine to make this electricity market a low hanging fruit for solar power. With 12% of all homes outfitted with PV, and solar power accounting for 4% of all electricity in 2013 by my estimate (including power produced and used by the same house, not just what goes over the grid), what's happening in Hawaii can help us understand what will happen with global PV.

The higher slope shows that Hawaii has more quickly adopted solar, because of all the factors which make solar so attractive there. (Data was hard to find here, so my data for 2012 and 2013 assumes that total power produced stayed the same as it was in 2011). My model suggests that solar should account for half of all power produced in Hawaii by 2018, which is breathtakingly sudden - but that model doesn't know about the bad news. There's been a big controversy about solar power on the islands, with the utility companies slowing down permits for residential installations, citing safety (the transmission lines, which were originally designed simply to deliver power from a few big sources to many small consumers, can't handle all the excess solar power generated during the day) while critics accuse the companies of protecting their own interests at the expense of residents. This has led to some people seceding from the grid, installing batteries to store their excess daytime energy for nighttime use. This is a taste of the barriers the rest of us will face in a few years, when local solar power production starts becoming significant. Can this be solved by simply installing a more robust power grid? Does each household need to buy a huge battery to help smooth out demand?

Regardless of these barriers, I'm still very excited about the near future of solar power.

Monday, July 27, 2015

New Mexico in Presidential politics

In this installment of the state-by-state series, I examine the newest Mexico there is, New Mexico. A relatively small state with relatively large swings in its margin of victory, to the intelligent human eye it seems to be somewhat unpredictable, with perhaps a chance of being a bit more democratic than the nation as a whole.

Democrats did better in New Mexico than in the nation as a whole in 5 of the last 7 presidential elections, and when they did worse, it was only by 1-2%. By contrast, when democrats did better in New Mexico than they did in the nation as a whole, they've lately been doing 6-10% better. This adds up to a prediction that democrats will do better in New Mexico than the nation as a whole by about 7.1% (based on my simple linear fit model). This is a close one, but I'm going to color it blue in our little map:

The Democrats seem to be doing well. However, keep in mind that in this map, blue and red are more like the projections of which party would win that state if the overall popular vote was at or near a tie. If one party has a large 4% advantage over the other, then a state like New Mexico, Nevada, Virginia, or North Carolina may well flip.

Friday, July 17, 2015

New Hampshire in presidential politics

Measurements of smaller populations should have larger uncertainty and error bars - and this is exactly what we see in New Hampshire, the smallest state to be covered so far on this blog series. Aside from a spectacular win by George H. W. Bush in 1988, New Hampshire has fluttered back and forth from republican-leaning in 1992 to democratic-leaning in 1996, back to the right in 2000, and finally back to the left for the following 3 elections since. I'll interpret this to mean that the Dukakis campaign probably abandoned all hope of winning there, and focused instead on other states. Subsequent campaigns probably focused more on New Hampshire, bringing it closer to the center.

We can see the somewhat ridiculous prediction by my naive linear model: an 8.9% advantage by the democrat, with rather large 4.6% error bars. Any real person looking at this data would predict that it'll probably be much closer, with perhaps a small democratic advantage (neglecting 1988 from my linear fit model - without any objective basis - gives a prediction of a smaller democratic advantage of 0.8-5.4%). My model could benefit from some way of weighting recent elections more heavily than long-ago elections. Maybe next time.

Coming up sometime soon (maybe) by popular demand: including the midterm election data in my prediction and analysis!

Thursday, July 16, 2015

Arizona in Presidential Politics

Good old Arizona. I've seen a fair bit of interest on the left in a demographic advantage that Democrats my someday gain in Arizona (and other states, mostly in the South). So when I analyzed Arizona's margins in the last 7 elections, I was expecting to find some interesting wiggles and bounces. I was disappointed.


Aside from a small bounce for Republicans in 2008 (caused by hometown hero John McCain at the top of the ticket), Arizona has had little movement over the past 7 elections. In constructing my simple linear model, I excluded the 2008 data, and got a prediction that in 2016, Arizona will vote about 10% more republican than the nation as a whole. As it always has.

Blatantly screen-grabbing another website that lets me easily make my own little predicted map of the 2016 election, here's what we've got so far:

In this map I've shaded the states red or blue based on my guess as to whether or not a given party has a large advantage in that state. In other words, democrats won't necessarily win Pennsylvania, but if they've lost Pennsylvania, it will be because they've done very poorly in the national popular vote. As I visit each state on this blog, I'll fill in more states on this map, or leave them blank if they're true toss-up states. But as of right now, Democrats seem to be sitting pretty.

Astute readers will note that I have declared certain states without presenting a detailed analysis. For some of those states, I'll visit them in forthcoming posts. For others, I'll just let the history speak for itself (and if you want to gamble that Wyoming breaks blue, I'll take that bet).

Wednesday, July 15, 2015

Missouri: A Bellwether state from yesteryear

Until 2008, Missouri had the longest unbroken streak of electing the presidential candidate who ended up winning the presidency (although not always the popular vote). But during the last two cycles, Missouri abandoned its bellwether status, breaking toward the republicans even when Barack Obama won the national popular vote by more than seven points.

Starting in 1996, Missouri started drifting to the right of the nation as a whole, culminating in a 10% romp for Romney in 2012 while the nation voted for Obama by 4%. Based on my simple linear model, Missouri is almost certain to break for Republicans by a large margin.

Tuesday, July 14, 2015

Nevada in presidential politics

The next stop for our tour of possible swing states is Nevada.

We can see a pretty clear case of a state that has shifted somewhat from flirting with the republican party to flirting with the democratic party. Based on my extremely simple model, if this trend continues, Nevada has an 84% chance of voting at least 4.8% more democratic than the nation as a whole.

What might be causing this slow-and-steady shift to the left for Nevada? Perhaps an influx of minorities and young workers.

Monday, July 13, 2015

Kansas in Presidential Politics

Just a quick post that looks like all the others. Here I focus on Kansas, and how it has shifted from 5% more republican than the rest of the country, to reliably 25%+ more republican than the U.S. as a whole.
In contrast to the previous two states I've analyzed, Kansas clearly and definitively departed the "swing state" zone a long time ago. It's probable that neither party bothered to mount much of a campaign, causing Kansas to quickly shift to some kind of "natural state", the way it votes for president when it isn't a focus for both campaigns. And for Kansas, that natural state seems to be solid red.

Thursday, July 9, 2015

Pennsylvania in presidential politics

This is the next post in our series, "How are the swing states doing anyway?" Next up, we have Pennsylvania, which has been consistently just a little more democratic than the nation as a whole:

It has jumped around a little bit, so it's hard to discern any real trend other than "probably steady". Quantitatively this translates into our 2016 prediction: Pennsylvania will probably be around 2.6% more democratic than the rest of the nation (68% chance for a democratic advantage between 1.15-4.05%, with large assumptions including a straight-line fit through the historic dem advantage).

Without a clear trend, I won't even try to come up with any kind of guess about what demographic, political, or economic events could have been causing these observed numbers.

Once I complete this kind of analysis for all of the swingier states, I'll be able to construct a model predicting which states are likely to be the tipping point states, and what kind of national vote totals will translate into an electoral college win on either side.

Monday, July 6, 2015

Virginia in presidential politics

I love projecting presidential elections way too early, so obviously it's time to start predicting for the 2016 Big Game!

Today, I wanted to talk specifically about Virginia. Until recently, Virginia has been considered "safely" Republican during the presidential election - even if you count 2008, when Barack Obama won the state. What do I mean?

Let's go back to 2008, when Barack Obama won Virginia by a 6.3% margin, while winning the US popular vote as a whole by 7.3%. Now let's say we adjust our magical "popular vote" dial, reducing the democrat's share of the popular vote equally among all the states. The first state to flip to the republicans would be North Carolina. Then Indiana, Florida, Ohio, and then Virginia, at which point John McCain would still have been 11 electoral votes shy of winning. On top of all those states, he would also have needed to flip Colorado and finally Iowa, which would have been unlikely if he hadn't ALREADY won Virginia. So, for Obama, Virginia was unnecessary to his win, and for McCain, winning Virginia would be a given if he had carried Colorado and Iowa, which would have been required to win the election. Let's use Nate Silver's terminology and designate Iowa the "Tipping Point State" for 2008. Under that model, either candidate just has to win Iowa and all the states on their side of Iowa, assuming each state has a reasonably similar per-capita elasticity (voter response to campaign activity) and each campaign has pretty good knowledge of current polling in each state. How will each state change with respect to the national average? Let's zoom in on Virginia:


In the graph above I've plotted Virginia's Democratic (2-party share) vote margin for the past seven presidential elections. Although the national and statewide margins bounce around chaotically, by looking at the difference ("how republican Virginia is compared to the nation as a whole"), we can see that Virginia has slowly but clearly been drifting away from Republicans since 1988, culminating (so far) in the 2012 election, when it had essentially the same vote margin as the nation as a whole. Based on a simple linear fit, I predict that in 2016, the democrat will get a higher margin in Virginia than nationwide, by about 2%, for the first time since FDR. That means that even if the Republican gets 51.00% of the national popular vote, they'd still lose Virginia.

[Update: the error bars show +/- one standard deviation from the linear model. In other words, if all my assumptions are true, there is a 68% chance that Virginia in 2016 will fall between the two error bars, and be somewhere between 0.8% and 3.3% more democratic than the country as a whole.]

I'm sure there are numerous expensive demographic studies out there detailing exactly why Virginia is drifting from right to center ... so does anyone want to trudge through them for me? My guesses at the moment:
1) growth in the DC suburbs and exburbs,
2) more generally, increasing urbanization throughout the state, and
3) a growing young and minority population, which is disproportionately happening in Virginia.

I hope to complete a similar analysis for all of the so-called "battleground" states, and calculate a prediction of the systematic advantage the democrat or republican has going into the election. I'd be so excited if the democrat won the electoral college but lost the popular vote; then we might finally see some bipartisan reform to the current broken electoral college system!

Friday, February 13, 2015

In defense of drinking milk


A hilariously inept article on why "adults should not be drinking milk" has inspired me to incompetently defend the vulgar and glorious drink I love so much. Full disclosure: I drink milk every day, I always have milk when I eat sweet starchy foods (cake, cookies, pancakes), and nothing will stop me from drinking milk.

Let me dissect this article point-by-point so that I might respond:

No other species can digest milk after babyhood.

There are plenty of things I'm going to keep doing, even though no other species can do it. Speak. Use modern medicine. Participate in a society. Develop and use tools. Kara Brown is free to eschew these things if she wants, although her picture shows her - gasp - wearing clothes! No other species can do that!
KaraBrown


Fewer than 40 percent of humans on earth can digest lactose post-childhood, and only 5 percent of Asians and 25 percent of African adults can properly digest milk. In case you're keeping score at home, those continents have most of the humans we got.
No one is trying to force lactose-intolerant people to drink milk. But just because a slim majority of adult humans can't digest milk, I should stop drinking - why? Out of solidarity? Will that help those poor unfortunate souls?
You know what the number one killer of adults in America is? Goddamn heart disease. If you enjoy living, put the milk down.

The average American drinks 44 gallons per year of soda, compared to 20.4 gallons of milk. I'll concede it possible that, for an adult with a healthy diet, milk is a less-healthy choice than water. But often it's replacing soda or juice. On top of that, many people choose low-fat or skim milk.

Point: You can get calcium from plenty of other foods.

True. For most adults I believe you can get a healthy amount of calcium from a well-planned  dairy-free diet. So if you're eating plenty of spinach, kale, collards, or okra every day, then you're getting enough calcium. Everyone else should consider having some cheese or milk occasionally.

Point: It's gross.


I love the mental image Kara Brown must have of people like me. Cut to a black-and-white scene of me sitting in the dark, alone in a large unfurnished room, pouring a big glass of milk with a look of dread. "Milk is so gross, I hate it. But I - must - drink it for some reason! Why oh why is the world like this?" In reality, those of us who drink milk do it because - news flash - we LIKE it. We don't think it's gross.

Monday, January 12, 2015

Switching from iPhone? Apple will ruin your life.

If you're thinking of buying an iPhone, here's a compelling reason not to. If you switch from an iphone to another kind of phone, apple will block all iphones from sending you text messages. This is similar to how Islam and other religions treat apostasy: with harsh penalties ranging from excommunication to death. Apple is the Saudi Arabia of tech companies.

The story:

I bought an iPhone early last year, but after it constantly did its best to enrage me at every opportunity, I switched to a non-i phone. After I switched, I eventually was fortunate enough to discover that apple was blocking text messages from other iphone users to my phone number, without notifying them or me. Many messages are still being blocked, months later, even after I called apple and asked them to fix it.

Here's how the "bug" works (they claim it's a bug although it's obviously intentional): When you open a new text message conversation on your iphone, iMessage checks its database to see whether the recipient is an iphone, and therefore eligible to receive an iMessage. To save money, apple cuts corners and sends an iMessage instead of an actual sms, which uses a different cellular network. If the iphone routes the message through iMessage, but the recipient doesn't use an iphone any more, then iMessage just gives up. But it doesn't tell the sender or recipient that there was an error. It tells the sender that their message was successfully sent, but does not actually send the message.

So if someone had sent me a message like this one: "Hey Forrest. I'm going through a rough time and I really need someone to talk to. Please give me a call" then I wouldn't have received it, but they would be told I received it, and they would assume I don't care enough to respond. If someone had sent me a message like this one: "Hey Forrest, your mom is in the hospital. Please come quickly" I wouldn't have received it.

When you switch from an iphone, apple assumes that someone will somehow tell iMessage that your phone number should be taken off the list - but they don't do it themselves! Their plan is to wait until you somehow figure out that that your personal communications are being blocked, search the internet for a bunch of possible solutions, and then finally discover the little known secret of deregistering your phone number from iMessage. But until recently there was no way to do this, so every message from an iphone to a previously-iphone number was just blocked. Apple received so many complaints about this issue that they finally made a website to deregister your phone number from iMessage. But there's a massive flaw in their "fix". If someone with an iphone has a conversation already open with you, it won't check again with iMessage whether the phone number is registered, so any new messages within that conversation will still not actually be sent to you. After struggling for an hour with apple tech support, I discovered that the only way to fix this is to call all of your friends and family, and tell them to delete all of their conversations with you. I hope if you do that, you'll also tell them how vindictive, greedy, and incompetent apple is, and urge them never to purchase an apple product or service again. Presumably a cackling undead Steve Jobs collects all the phone numbers that people submit on that website to sell to telemarketers, spammers, and al-Qaeda

I'm not an apple customer but I spent an hour today trying - and failing - to get apple to stop blocking personal text messages that my friends and family send me. Apple has programmed all its iphones to shun any apostates who leave the cult of iPhone.

[Update 1/12/2015] One day after I called and asked them to fix it, the "genius" at apple confirmed that there's nothing they can do. He repeated that the only way they could come up with to fix this problem is to call all of my friends, family, and coworkers, and tell them to ditch their iphones delete their conversations with me. To be clear, apple is intercepting and blocking personal text messages, and has refused to stop.

Saturday, September 28, 2013

Population Density compared to Partisan Lean

 So a website called "the atlantic cities" has a very interesting article about how the closer you live with your neighbors, the more left-leaning you're likely to be, and vice versa. What really raises my ire about their article, however, is the absolutely terrible plot they made published, which is a scatter-plot of congressional districts. Someone just spat the data out into Excel and went with the first image they could make. They did change the y-axis to a logarithmic scale, but they didn't change the fit to to match it! Here's my (much better) plot with the same data (or more accurate? their sources are slightly unclear).

 As you can see (because I literally spelled it out at the bottom), there's a significant correlation between population density and partisan lean. Every time you double the population density, the district is about 8.6 points more democratic. I made a similar histogram-type plot of the districts, sorting them into bins by density and reporting the average partisan lean of all congressional districts with similar densities (circle size is related to how many districts that circle represents).

As you can see, most districts are clustered between 100 and 10,000 people per square mile. If you examine the two trendlines I've drawn, the blue one represents how we should expect to find the districts, and the red one shows how it actually bends significantly. This demonstrates the level of gerrymandering that republicans have accomplished, maximizing the number of districts that are republican, even if just slightly, while shoving all democrats in their states into a few districts that are heavily democratic. This is how Republicans currently control the House of Representatives, despite receiving several million fewer votes in the House than Democrats received. 

(For more on the current Gerrymandered state of many districts, try this fun jigsaw-style quiz! It shows very well how ridiculously these districts' shapes have been contorted to skew the makeup of the House so much)

Saturday, January 5, 2013

Matt's probability question

A quick post since I don't have access right now to my beautiful plotting software.

My friend Matt asks a question: if I have 12 cards labelled 1-12, and each day I draw 3 without replacement, record which ones I've drawn, and then shuffle them back in for the next day, how many days should I expect to draw cards before I have drawn all 12?

Instead of doing actual math, I just used MATLAB and ran one million simulations (a nice round number). First I'll plot the probability of having drawn all 12 cards by day X

You can see that we cross 50% somewhere between day 11 and 12. Specifically, 46.4% of simulations were done by day 11, and 57.1% were done by day 12; Interpolating gives about 11.3. Even though I'm too lazy to do stat math for you, we can see the form of the equation if we plot the probability to not be done yet versus number of days (below). In a semilog (y) plot, it forms a straight line after about day 10.

Monday, December 10, 2012

United States of Moochers: Red vs Blue states

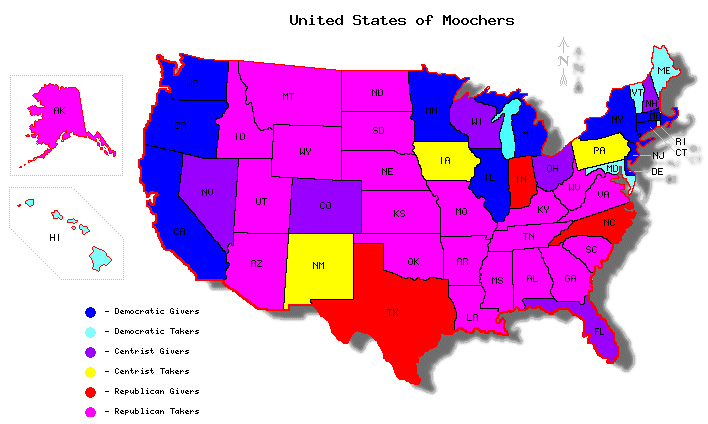
It's been a long campaign season, so I'm sure the first thing everyone wants to see is some extensive, in-depth political research! Some of you might remember an interesting figure that went around the internet a few years back. It sorts all US states into two columns, net contributors to the federal government vs. net takers; and two colors, red for republican and blue for democrat states. The conclusion is stark: republican states take more than they give to the federal budget, and democratic states give more than they take. But I thought the binary decision for each state (red or blue, giver or taker) was a bit simplistic, and it seems like it used just one snapshot of America (2004), so I did my own research. I gathered as much data as I could on the subject (sources were Wikipedia and the TaxFoundation.org). First, the normalized vote margins in the last 5 presidential elections (separated into colors at margin values of +/- 4% and +/-15%). Then the amount of money the federal government spends on each state, divided by the amount that state contributes, for the years 1981-2005, to get our "Mooching Factor".
Let red states secede if they want - that would solve our budget deficit instantly!
These results are also shown on this US map, where "Giver" states are given their normal red, blue, or purple, while the "Moocher" states are assigned the less-dignified colors of pink, cyan, and yellow.
You can clearly see that only 3/25 red states are givers (12%), while 11/16 blue states are givers (69%).  In fact, seven red states are bigger moochers than the worst blue state. But they say correlation (in this case 0.2, which is pretty weak) does not indicate causation. My first thought is that relative poverty rates in each state will be a determining factor. A state with richer people contributes more in taxes but takes less for social programs, right?
This explains part of the overall trend: red states tend to have higher poverty rates than blue states, so naturally they would be taking more money for social benefits while contributing less from taxes. But we see that all 10/10 (a shameful 100%) of "rich" red states still take more than they give, while only 4/13 (17%) of "rich" blue states do. Depressingly, poverty is less an indicator of whether a state is a giver or taker (0.12 correlation) than political lean (0.20). In the background you can see an aggregated "Redland" and "Blueland" (I didn't worry about "Purpleland"). We see that red states are significantly more impoverished, even though they have been receiving a "stimulus package" from blue states for at least 30 years running. But also interesting are the trends within Redland, where poorer red states don't necessarily take more than richer red states (the same is true for Blueland). It really looks like red states, not poor states, are inherently takers.

Another hypothesis is that each representative for a state is like a pig at the Federal Trough, grabbing as much money for their constituents as every other pig. That means that less-populous states, which have the same number of senators as big states, will have more congressional influence per capita, and therefore more federal money. I define "congressional influence" as the fraction of the House of Representatives that a state controls plus the fraction of the Senate that each state controls (this assumes both chambers of Congress are equal in budgetary power). In the plot below you can compare a state's congressional influence to its population by comparing the areas of the outer and inner circle; we see that for example, citizens of Wyoming have more than 10 times the congressional influence per capita as citizens of California.
It's evident that congressional influence is a large factor. Notably, each of the five most underrepresented states, regardless of political lean, all give more than they contribute. Over-represented red states are more likely to take more (all 18/18), while over-represented blue states are split evenly between givers and takers (5/10). This plot is perhaps the most damning of all for Republicans: it suggests that the only reason that any red states contribute more than they take is just because they don't have the congressional influence to grab more money from the Federal Trough, while blue states exercise fiscal restraint, even when they have the congressional influence to grab more money. Again, the implications are clear: Republican politicians greedily rake in as much money as they can for their states, while Democratic politicians govern toward some other goal, perhaps "the best interest of the country"? In the background of the figure we again see "Redland" and "Blueland", where Blueland has more people but less congressional influence, and therefore pays tribute every year to Redland. In fact, each citizen of Redland has 26.4% more congressional influence than a citizen of Blueland, which corresponds quite closely to their 26.4% higher Mooch Factor.

Red States Blue States
total moochers 88% (22/25) 31% (5/16)
fraction of poor states that are moochers86% (12/14)0% (0/2)
fraction of rich states that are moochers100% (10/10)31% (4/13)
fraction of under-represented states that are moochers 57% (4/7) 0% (0/6)
fraction of over-represented states that are moochers 100% (18/18) 50% (5/10)
Federal money spent/contributed ("Mooch Factor") 1.16 0.91
poverty rate 14.3% 11.7%
US population fraction 39% 41%
fraction of congress ("congressional influence") 44% 37%

Aren't Republicans supposed to be fiscally-responsible small-government advocates? If blue states are taking less but still have lower poverty for 30 years now, perhaps their governing model is more successful: social services to people in need, rather than trickle-down Reaganomics for the wealthy.

Thursday, August 16, 2012

Too lazy to "Occupy"? Hit the ATM.


When the "Occupy" movement first started, I felt like there were some legitimate claims buried in somewhat incoherent message. To me, the most compelling complaint is related to the increasing separation of wealth, how "the rich get richer". For example, since Reagan took office, the increase in after-tax income has leapt significantly for the richest Americans (much of which can be explained by Reagan slashing taxes for the richest Americans), while rising only modestly for the bottom 80%.


Increase in After-Tax Income by Income Group 1979-2007
Source: Congressional Budget Office

What is causing this increasing separation of wealth? Why are the rich getting way, way richer, while everyone else is making only modest gains? Well that growth in the top 1% starting from 2002, which as you can see is not reflected among the poorer 99%, corresponds roughly with the Bush Tax Cuts for the wealthy. It just seems like a shameful state of affairs when companies consider the "Return On Investment" for lobbyists and campaign contributions. The wealthy spend some of their money on influencing politicians, who devise laws that benefit the wealthy at the expense of everyone else. Everybody wins!

But I didn't really want to talk politics too much today. I guess it's just the little things that bother me. The banks offer you and me 1% cash back for using their credit cards, but they charge the vendor 3%, which the vendor turns around and charges us, through increased prices, even for those of us who use cash. In fact it's against the law to charge a higher price for consumers who use credit cards; guess who wrote that law? So we're stuck in a cycle where the banks make 3% on every transaction, for doing almost nothing.

Now, when the Occupiers started Occupying, I figured "I have a job, I don't have time to stand around complaining all day." But now I can see one small way we can all support income equality, without quitting our day jobs: visit the ATM. The bank earns nothing on cash transactions. When you use your credit card for $100, you are basically hiring the bank to walk over to the ATM, withdraw $100, and give it to the cashier, and you are paying $3 for this service. If instead we all visit the ATM once a week and pay most of our transactions in cash, we save that money, resulting in lowered prices for consumers and higher revenues for business which actually produce economic value. For a person making the median personal income in the USA, $32,000, who spends 30% of their income through their credit card, they are paying almost $300 per year to the banks.

If you want to combat the growing wealth disparity in the USA, and help ensure that less money is paid to companies that don't actually produce any economic value, hit the ATM once a week. 

Monday, June 18, 2012

A closer look at FiveThirtyEight's Presidential Election Simulator

I've always been a fan of the presidential election simulator they've developed over at FiveThirtyEight. Essentially they use a pretty complicated model to give a prediction of which candidate will win in which state, and then run some simulations to predict which candidate will win the overall election. It seems like most of the work goes into re-calibrating the results of polls and combining some pretty complicated factors that I won't go into here (since I'm not too familiar with their methodology on that level), but what they've done with that second part is what I'd like to suggest an improvement on. They use their current estimate about which candidate will win each state, then run simulations to predict the overall winner. The histogram from their website looks like this:
Based on my experience with simulations, you shouldn't normally have a few peaks much taller than the rest; this is a symptom of an illness I like to call Not-Enough-Simulations. If they just run more iterations, they'll get a much nicer and smoother curve. To demonstrate, I went through and grabbed their current prediction for the odds that Pres. Obama wins each state or district (for ME, NB, and DC), and just ran some simulations where for each state I randomly choose who wins, weighted by those odds, and tabulate the totals. I want to point out here that the model at 538 has some extra features which mine doesn't have, like how states don't vote independently, regional and economic influences, poll movements, and others, I'm sure. So this is purely for demonstrative purposes. Anyways, for three hundred simulated elections, this is what it looks like:


Does that look familiar? For reference, in my code that I just knocked together in a few minutes, that takes way less than one second. For one billion runs (which admittedly takes a few minutes), this is what I get:


It's a nearly perfect, beautiful bell curve. This represents the true result of their statistics. Another result of running more simulations is that the odds of who wins the overall elections is measured more accurately, and the number changes a little bit. Their "now-cast" function, which is what I'm actually mimicking, predicts what would happen if the election were held today. It gives Obama a 64.7% chance of winning. Instead, it should be a 64.2% chance, if you collect enough data. That's a small difference, but here's one more. They also calculate the chance of a 269-269 tie in the EC, which they give as 0.6%. But with less-noisy data, it's actually 1.5%, more than twice as likely.

It's a shame to see all the hard work the people at FiveThirtyEight put into their model at the state-level, just to have it under-sold with such a simple bug in their nation-wide model. They need more simulations!

Friday, January 20, 2012

Our broken Electoral System

When Americans elect a president every 4 years, the method we use is actually pretty strange when you stop to think about it:

1) Every state gets a number of votes equal to their number of representatives plus two. These are called "electoral votes".
2) 48 of the 50 states use a winner-takes-all system, where whichever presidential candidate gets the most votes in that state gets ALL the electoral votes of that state. The other two states use an adaptation of that method, where each candidate gets an electoral vote for each congressional district they win, plus two more for winning the overall state popular vote.

Electoral College for the year 2000


A notable side-effect of this policy is that someone can become President of the United States while losing the popular vote. This has happened 4 times out of 55 US presidential elections, or 7% of the time. Maybe that seems like an acceptably small fraction to you, but consider that there are also cases where it was very close to happening, like in 2004: Bush II had about 3,500,000 more nationwide votes than Kerry, but if 60,000 Bush voters had changed their minds and voted for Kerry in just one state (Ohio), he would have become the president. In the last 60 years, a "close" election like this, where fewer than 60,000 voters could've made the wrong man President, has come close to happening 6 times, meaning that 6/15 or 40% of recent elections were problematic.

For fun, I've taken the liberty of running some simulations. Each state is given its share of electoral votes as of the 2000 census, I specify the national popular vote totals and give each state its own vote total, normally distributed about the national mean, with a standard deviation taken from the last three presidential elections (about 11% each time). Then I check to see if the national popular vote winner is also the electoral college winner.

For an example election that's 48/52 (i.e. a 4% margin for one candidate), I ran this simulation 1,000,000 times, and here are the EV results:


We see that in more than 10% of the runs, the national popular vote winner does not become the president. Repeating this process for a collection of margins, I find the probability of the "wrong president" vs. national popular vote margin:


I also show the last eight elections as vertical lines on the bottom, highlighting in red the one that gave us the "wrong" person. Statistically speaking, we should have seen on average 1.3 "wrong" presidents in the past 8 elections. Reality, however, is constrained to integers in this case, so it's really no huge anomaly that we got 1 error out of 8. What's surprising to me is how astonishingly poor this system is at electing the popular vote winner to the presidency. With a national popular vote margin of 4% we get an error of 10%. With a margin of 1% we get an error of 37%. For margins smaller than 1% we may as well flip a coin, even though 1% represents more than 3,000,000 Americans.

Raw data is tabulated below. For reference, the margins of the last 8 elections ranged between 0.5% and 10%. The real miracle here is that we have had only four wrongly-elected presidents out of 55!


Popular Vote Margin
Probability of Wrong President
10%
0.06%
8%
0.52%
6%
2.7%
4%
10.4%
2%
26%
1%
37%
0.4%
44%
0.2%
47%


Sunday, January 15, 2012

How big is the Universe?

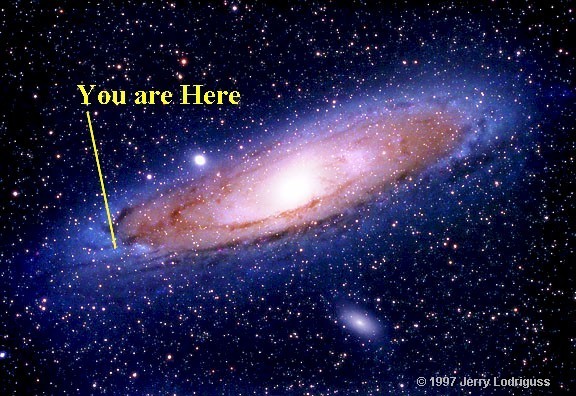
Hello everyone, and sorry for the long time since my last post. Today I'll be giving an in-depth and unqualified analysis of current astronomy and cosmology. What I find interesting is the pace at which our knowledge of the universe's structure has developed.

1)Starting with ancient cultures, we have known or speculated that we live on a sphere ("Earth") nearby some other objects (the sun and planets), which are all surrounded by little twinkly lights (other stars). Assigning a date and person to this discovery is tricky, but a good guess is an African named Eratosthenes in Egypt, who measured the earth's diameter in ~200 BCE. He did this by noting that on the summer solstice, the sun shone exactly straight down in one city, but cast a shadow about 1/50th of a circle in another city. He knew the difference in the distance between the two cities, and using "math" he calculated the diameter of the earth. So the size of the known universe, in our understanding, was the earth's diameter: 12,800 km.

2)It wasn't until Johann Kepler in the 1600s that we were relatively confident that our Earth was not fixed, but was moving around the sun (and not the other way around). This had been hypothesized before, but only at that time had it been proven and accepted. This increased the size of the known universe to the diameter of the major axis of Saturn's orbit (then the furthest known planet): 1.4 billion km.

3)Even then, it wasn't until Frederich Bessel in 1838 that we confirmed that the other points of light in our sky are stars similar to our sun, and found the distances between them. He did this by measuring the angle of a "nearby" star against the background, further away stars as the earth moved in its orbit. Just like the two images from our eyes allow us to tell the distance to something, this parallax allowed us to calculate the distance to the stars. Until then the working theory was that they were unknown lights, possibly infinitely far away. Now the size of the known universe became the size of our galaxy: 950 million billion km.
4)Only in the twentieth century did we realize that our galaxy was not the entire universe, but merely one tiny, tiny piece of it. Edwin Hubble helped us realize this when he observed objects receding away from us much more quickly than the escape velocity of our galaxy, and this was later confirmed by measuring the brightness of certain standard objects (e.g. Cepheid Variables or Type 1a Supernovas) within those galaxies. This inflated our known universe to the distance between these "nearby" galaxies, about 60 billion billion km.

5) At about the same time, we discovered that the universe is expanding. Our perception of the size of the universe expanded with it, until in the 1960s we found the observational limit: a distance so far that the light has travelled for about 13-14 billion years. Wikipedia explains this barrier nicely:
In practice, we can see light only from as far back as the time of photon decoupling in the recombination epoch, which is when particles were first able to emit photons that were not quickly re-absorbed by other particles, before which the Universe was filled with a plasma opaque to photons. The collection of points in space at just the right distance so that photons emitted at the time of photon decoupling would be reaching us today form the surface of last scattering, and the photons emitted at the surface of last scattering are the ones we detect today as the cosmic microwave background radiation (CMBR).
Now, you might think that that means the limit of our observable universe is a sphere of diameter 13 billion light-years. However, because space itself has expanded during that time, the objects we are observing from 13 billion years ago are now much farther away, meaning the diameter of the observable universe is almost one million billion billion km.

5) And only very recently (1998) have we realized that the expansion of the universe is accelerating, a prediction which completely alters our view of the universe's fate. Current cosmological thinking has no estimate for the boundary of the universe. Our observable universe might be a tiny bubble in an infinite volume; the new estimate is literally "infinity until further notice".

Each of these five discoveries monumentally changed our understanding of the universe. Each time, the universe becomes monstrously larger than we had previously thought, and all of our assumptions become completely challenged. I have taken the liberty of tabulating the size of the "known universe" along with the date, for demonstration purposes:

datesize of known universe (km)note
200 BCE12,800diameter of the earth
16001,400,000,000size of our solar system
1838950,000,000,000,000,000diameter of our galaxy
192460,000,000,000,000,000,000size of our "local group" of galaxies
1960s1,000,000,000,000,000,000,000,000size of the observable universe
1998"literally infinity"astronomers give up

I observe that the rate of this growth as a function of time is not governed by any reasonable function, but might be considered to be logarithmic starting in 1600, with our known universe expanding by a factor of 10 every 24 years until recently, when astronomers simply gave up. This rate of growth (in understanding) is, I'm sorry, astronomical.

There are still so many unresolved questions about the nature of our universe. So-called "dark matter" is required to explain why galaxies spin the way they do, and it has been detected indirectly, but we still have no idea about its nature. If it exists, there is postulated to be five times as much of it, whatever it is, than "regular" matter. Things become stranger: in order to explain the accelerating expansion of the universe, astronomers and cosmologists posit a "dark energy", an unknown force that would have to have 20 times as much "mass-energy" as observable mass in the universe. Mass-energy is the unit used because, as Einstein showed, energy can be converted into matter, or vice versa. If we converted all the dark energy into regular matter, there would be 20 times as much of it.

To butcher a quote by Socrates, "A wise man understands that he knows nothing." The more we study, the less we seem to understand. Maybe that's just the nature of the universe.

Tuesday, January 18, 2011

An unqualified summary of alternative energy

Hey guys! I'm no Energician or anything, but I do have some BS degree from this one school in the south, so I'm going to just go ahead and offer my (in)expert opinion on alternative energy.

When you come right down to it, most of our energy sources are solar energy in disguise. Coal, oil, and natural gas were formed when plants stored the sun's energy in their biomass and then decomposed. Hydroelectricity is available when water is flowing downhill, and we force it to turn our turbines; but that water was transported to the top of the hill when it was evaporated by sunlight, and fell back down from the sky. Wind exists on Earth only because of local variations in temperature, caused (for the most part) by sunlight. And, of course, solar panels directly harvest the sun's energy. In fact, the only sources of power I can think of that don't originate from the sun are nuclear power and (arguably) geothermal.

One very interesting energy harvesting scheme is called "Ocean Thermal Energy Conversion". Essentially you have a huge pipe that goes down into the ocean to a depth of about 1,000 m, where the water is colder, about 5 C. At the same time you use water from the surface, which will be around 22 C. The laws of thermodynamics dictate that the heat will flow from hot to cold, but we put our devices in the way so that, like water falling down a hill, the whole process powers our machinations. And they say that the oceans provide a "limitless" supply of cold and hot water (maybe a dangerous idea).

Direct solar energy has a lot of promise. The above map shows the average intensity of sunlight. The blue dots represent the total area required, with current technology, to completely provide the current global demand for electricity. I think the map looks pretty neat.

However, as time wears on, our energy demands will tend to grow exponentially. Some guy made what's called the Kardashev Scale, which classifies how "advanced" a civilization is based on how much energy it can produce. To quote wikipedia, "a Type I civilization has achieved mastery of the resources of its home planet, Type II of its solar system, and Type III of its galaxy." We are estimated to have a rating of 0.72. Looking at the plot, which is on a logarithmic scale, our energy development over time is a straight line, which indicates exponential growth. Extrapolating from the data in just the last 110 years, it will take another 200 years or more to reach a rating of 1. Let's work on that, everybody.

EDIT: So on the Kardashev Scale, a Type 2 civilization will use roughly the energy output of an entire star. Freeman Dyson imagined what is now called a Dyson Sphere, a shell around a star that collects all the energy from that star. Dyson spheres have a few problems, though: If you build a solid shell around the star, then it wouldn't interact gravitationally with the star, and the two would slowly drift apart until they collided. If, instead, you build a swarm of space ships that orbits the star, then occasionally one would block the sun from the other. As you increase the number of spaceships, this happens more and more, until it becomes almost impossible to harvest all the star's energy.

Friday, January 14, 2011

Apocalypse hypothetical


Imagine the following scenario: Astronomers have found an asteroid on a collision course with earth. It will destroy out civilization and kill all humans on the planet. However, that won't happen for another ten years. A large number of the world's top scientists have come together to try and solve the problem, and they have concluded that we will not be able to deflect the object from hitting Earth. The only chance for the continued survival of humanity is to send a spacecraft full of people, which might survive in space for the several thousand years necessary for the earth to become habitable. Each person in the world is given a choice: If you dedicate the next ten years of your life to helping build the space station, you will be entered into the lottery for a ticket onto the space station. You can give the ticket to whomever you want. Otherwise, you can just relax for ten years, and join the biggest party of mass hedonism since Caligula. What would you choose?

So the scenario doesn't say what your chances of getting a ticket are. Most likely, that would be determined by how much work the people get done in ten years. How many people are necessary to repopulate the world? Preliminary research (i.e. google search) points to somewhere around 1,000, to avoid inbreeding. So probably the best strategy is to have as many self-contained satellite habitats orbiting the earth, each with 1,000 people. And then hopefully at least one of these will survive. Another strategy is to have just one massive space ship, but that's a bad idea since then it only takes one big mistake or accident (or crazy person) to destroy it.

So I'm looking at the situation where for two to three years, the scientists perfect a few models of space ship, then every factory in the world starts making as many of them as they can. Wikipedia says that in the last 50 years or so, only about 550 people have been launched into space. But our technology has grown exponentially (even though we are no longer capable of going to the moon) If we can devote a significant fraction of the world's GDP to this project, then we might be able to produce a few dozen of these space stations. . If we devote all our time and money to this problem, maybe we will be able to launch a few dozen of them before time runs out. So that's about 12,000 people who will be saved. At the same time, I would estimate that about half of the world's population would support this effort, that's about 3,000,000. That's a 1/25,000 chance for each person. A tiny chance, but perhaps worth it, if you know that you did your part in helping humanity avoid extinction?

Over several thousand years, each space station will undoubtedly develop its own culture and civilization, even if there is constant communication between space ships. Will they attack each other? If our space station's air filter breaks, will we raid another's, dooming them and saving ourselves? More likely, all space stations will work together, helping each other

Next is the problem of recolonization. When all the surviving space ships land, there might be some hostility between them. One issue is when, exactly, to land. If our space ship lands earlier than the others, we will have more time to set up a prosperous city and multiply. Later than the others, and we will have a more hospitable Earth to greet us. However, most likely there will be more than enough Earth for everybody, so this hostility probably won't cause human extinction.

A different possibility is to make a space craft that is capable of building more copies of itself from raw materials (moon rocks? asteroids?). That way we just launch a few "seed ships" and in a few millennia there will be hundreds or thousands ready to land. And in that case some may not want to land, but instead might move to other parts of the solar system (or to different stars!). This actually seems to me like a necessary step in the development of our civilization. With space stations that are not only self-reliant but also are capable of reproducing, we change all of space into a possible habitat for humanity. And in that case there's no need ever to return to Earth. We might just send it a post-card, though.