Wednesday, September 9, 2015

Solar power at a critical mass

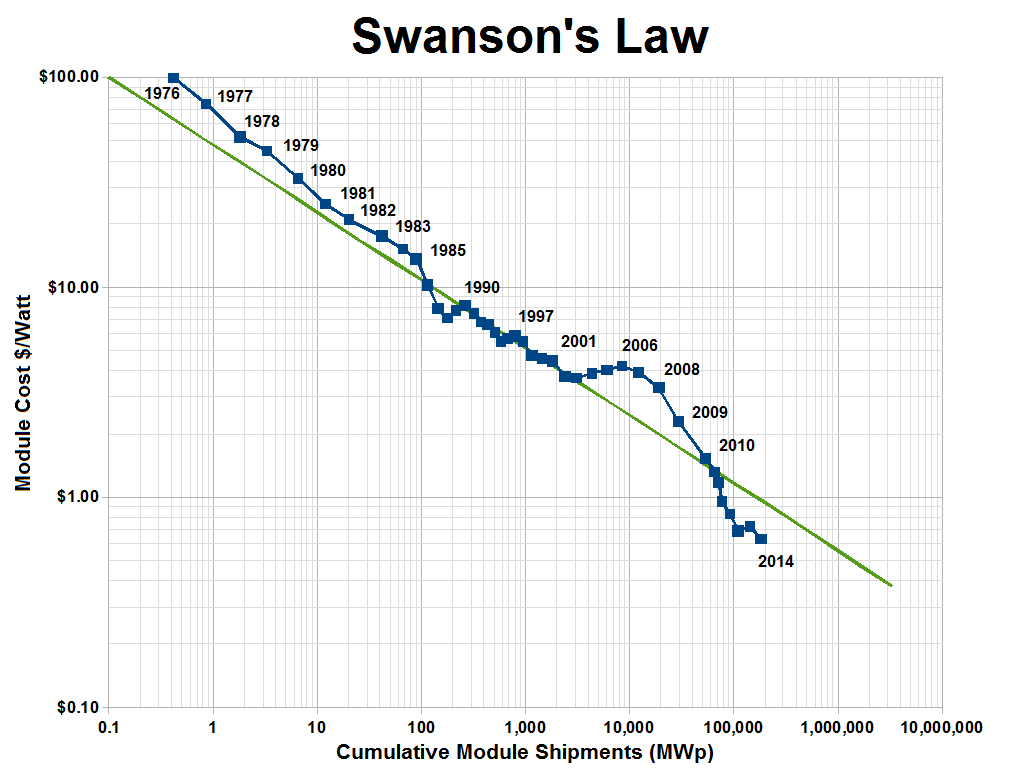
I've been reading science news, and I noticed that photovoltaic systems are rapidly becoming cheaper, and new PV solar power plants are constantly being built all over the world. This seems to be mostly the effect of pure economics - solar power is becoming competitive with coal/gas in many areas - than from governmental incentives or environmental considerations. From Wikipedia, we have a plot of PV cost vs year, showing a "Moore's Law"-type decrease every year, which is apparently called "Swanson's Law":
I'm not sure who tried to make that green line fit with the blue data but it doesn't look like a good fit. It seems like the cost is decreasing even faster than the original estimate of being cut in half every ten years. So how has that affected the total installed solar power capacity?

You can see that installed PV capacity, as a share of global electricity capacity, is increasing exponentially for now (sigmoidally once it has a significant percentage). My (very) simple and optimistic model predicts that half of all global electricity will be solar power by 2025. Ten years is a very short amount of time to go from less than 1% to more than 50%, so I would take this prediction with a big grain of salt. Some reasons why this model may be way off:

  1. People are installing PV in the sunniest places with the highest energy costs, basically going after the lowest-hanging fruit. Once those places are saturated with PV, it'll be harder to convince people in cloudier places and with abundant fossil fuels to start investing in solar power. I'm sure there's an economic model of this phenomenon somewhere, but for now I'll defer to this headache-inducing technology adoption curve, which shows how disruptive technologies like electricity, refrigerators, clothes washers, autos, ACs, and internets are adopted over time. The main difference between these appliances/services and solar power is, anyone can install a few solar panels and sell electricity to their neighbors, but you can't easily opt-out of using solar electricity if your neighbor or utility company is providing that.
  2. Economies of scale get tricky here. On the one hand, as we study this system and build more of these things, we get better and more efficient at doing it, making the process cheaper per panel. On the other hand, building a lot of these panels will start to impact the availability of raw materials necessary for them, like tellurium (required for a certain type of PV) or lithium (required to store the energy from PV until people want to use it).
  3. Sunlight only shines during the day, and more in the summer than the winter. So once a certain area has enough PV to provide all daytime electricity demand, it won't be very useful to add any more PV unless there's some way to store that energy (like with batteries).
  4. There's a large up-front cost for making changes, like shifting from coal to solar power. Your state might save $20M per year by building a solar power plant, but if you don't have the $100M to build it, and you do still have a fully operational coal power plant, then which one are you going to use? 
  5. One huge source of carbon emissions that isn't included in the above chart is transportation fuels, primarily oil. Once electric cars have a comparable range to combustion cars, then cheap solar electricity may cause a widespread shift to electric vehicles. This might increase demand, but would also allow for that demand to be more flexible: You plug your car in when you arrive home, and you tell its nightrider-style computer, "buy electricity whenever it's cheapest, but make sure I have at least 50 miles of range by tomorrow morning". All the cars in your area will be doing the same thing, so when demand spikes or supply drops, they'll all pause, but when supply spikes or demand drops, they'll all start slurping those precious Amps. This will serve to help demand adapt to fit supply, keep the prices relatively steady, and keep electricity availability more stable. On top of that, those cars might further be programmed to "buy low and sell high", automatically selling energy back to the grid when it's expensive, earning their owners a few extra dollars a month, and further contorting electricity demand to more closely fit supply.
  6. My sigmoidal model assumes that, eventually, all electricity will be made with solar power, but that's clearly not going to happen. For many cities and countries, it won't make sense to shut down their perfectly-good coal/nuclear/whatever plant until it breaks down. So I recalculated my fit to assume that solar power will only ever hit 60% of global electricity production, and the prediction is only delayed by three years: half of all electricity will be solar power by 2028. A quick note on the math here: since, as you can see in the semilog plot above, electricity has not left the "exponential" phase of the sigmoid shape - in other words, because it's so early and it only accounts for 0.9% of global supply - it's hard to predict where it will level off. I can get my model to fit with a correlation coefficient of 0.99 with a predicted maximum PV saturation as low as 3% of global supply. But we will know the answers within the next 5-10 years.

Case Study: Hawaii

Let's look a little closer at Hawaii, where expensive diesel-powered electricity and sunny days combine to make this electricity market a low hanging fruit for solar power. With 12% of all homes outfitted with PV, and solar power accounting for 4% of all electricity in 2013 by my estimate (including power produced and used by the same house, not just what goes over the grid), what's happening in Hawaii can help us understand what will happen with global PV.

The higher slope shows that Hawaii has more quickly adopted solar, because of all the factors which make solar so attractive there. (Data was hard to find here, so my data for 2012 and 2013 assumes that total power produced stayed the same as it was in 2011). My model suggests that solar should account for half of all power produced in Hawaii by 2018, which is breathtakingly sudden - but that model doesn't know about the bad news. There's been a big controversy about solar power on the islands, with the utility companies slowing down permits for residential installations, citing safety (the transmission lines, which were originally designed simply to deliver power from a few big sources to many small consumers, can't handle all the excess solar power generated during the day) while critics accuse the companies of protecting their own interests at the expense of residents. This has led to some people seceding from the grid, installing batteries to store their excess daytime energy for nighttime use. This is a taste of the barriers the rest of us will face in a few years, when local solar power production starts becoming significant. Can this be solved by simply installing a more robust power grid? Does each household need to buy a huge battery to help smooth out demand?

Regardless of these barriers, I'm still very excited about the near future of solar power.

Monday, July 27, 2015

New Mexico in Presidential politics

In this installment of the state-by-state series, I examine the newest Mexico there is, New Mexico. A relatively small state with relatively large swings in its margin of victory, to the intelligent human eye it seems to be somewhat unpredictable, with perhaps a chance of being a bit more democratic than the nation as a whole.

Democrats did better in New Mexico than in the nation as a whole in 5 of the last 7 presidential elections, and when they did worse, it was only by 1-2%. By contrast, when democrats did better in New Mexico than they did in the nation as a whole, they've lately been doing 6-10% better. This adds up to a prediction that democrats will do better in New Mexico than the nation as a whole by about 7.1% (based on my simple linear fit model). This is a close one, but I'm going to color it blue in our little map:

The Democrats seem to be doing well. However, keep in mind that in this map, blue and red are more like the projections of which party would win that state if the overall popular vote was at or near a tie. If one party has a large 4% advantage over the other, then a state like New Mexico, Nevada, Virginia, or North Carolina may well flip.

Friday, July 17, 2015

New Hampshire in presidential politics

Measurements of smaller populations should have larger uncertainty and error bars - and this is exactly what we see in New Hampshire, the smallest state to be covered so far on this blog series. Aside from a spectacular win by George H. W. Bush in 1988, New Hampshire has fluttered back and forth from republican-leaning in 1992 to democratic-leaning in 1996, back to the right in 2000, and finally back to the left for the following 3 elections since. I'll interpret this to mean that the Dukakis campaign probably abandoned all hope of winning there, and focused instead on other states. Subsequent campaigns probably focused more on New Hampshire, bringing it closer to the center.

We can see the somewhat ridiculous prediction by my naive linear model: an 8.9% advantage by the democrat, with rather large 4.6% error bars. Any real person looking at this data would predict that it'll probably be much closer, with perhaps a small democratic advantage (neglecting 1988 from my linear fit model - without any objective basis - gives a prediction of a smaller democratic advantage of 0.8-5.4%). My model could benefit from some way of weighting recent elections more heavily than long-ago elections. Maybe next time.

Coming up sometime soon (maybe) by popular demand: including the midterm election data in my prediction and analysis!

Thursday, July 16, 2015

Arizona in Presidential Politics

Good old Arizona. I've seen a fair bit of interest on the left in a demographic advantage that Democrats my someday gain in Arizona (and other states, mostly in the South). So when I analyzed Arizona's margins in the last 7 elections, I was expecting to find some interesting wiggles and bounces. I was disappointed.


Aside from a small bounce for Republicans in 2008 (caused by hometown hero John McCain at the top of the ticket), Arizona has had little movement over the past 7 elections. In constructing my simple linear model, I excluded the 2008 data, and got a prediction that in 2016, Arizona will vote about 10% more republican than the nation as a whole. As it always has.

Blatantly screen-grabbing another website that lets me easily make my own little predicted map of the 2016 election, here's what we've got so far:

In this map I've shaded the states red or blue based on my guess as to whether or not a given party has a large advantage in that state. In other words, democrats won't necessarily win Pennsylvania, but if they've lost Pennsylvania, it will be because they've done very poorly in the national popular vote. As I visit each state on this blog, I'll fill in more states on this map, or leave them blank if they're true toss-up states. But as of right now, Democrats seem to be sitting pretty.

Astute readers will note that I have declared certain states without presenting a detailed analysis. For some of those states, I'll visit them in forthcoming posts. For others, I'll just let the history speak for itself (and if you want to gamble that Wyoming breaks blue, I'll take that bet).

Wednesday, July 15, 2015

Missouri: A Bellwether state from yesteryear

Until 2008, Missouri had the longest unbroken streak of electing the presidential candidate who ended up winning the presidency (although not always the popular vote). But during the last two cycles, Missouri abandoned its bellwether status, breaking toward the republicans even when Barack Obama won the national popular vote by more than seven points.

Starting in 1996, Missouri started drifting to the right of the nation as a whole, culminating in a 10% romp for Romney in 2012 while the nation voted for Obama by 4%. Based on my simple linear model, Missouri is almost certain to break for Republicans by a large margin.

Tuesday, July 14, 2015

Nevada in presidential politics

The next stop for our tour of possible swing states is Nevada.

We can see a pretty clear case of a state that has shifted somewhat from flirting with the republican party to flirting with the democratic party. Based on my extremely simple model, if this trend continues, Nevada has an 84% chance of voting at least 4.8% more democratic than the nation as a whole.

What might be causing this slow-and-steady shift to the left for Nevada? Perhaps an influx of minorities and young workers.

Monday, July 13, 2015

Kansas in Presidential Politics

Just a quick post that looks like all the others. Here I focus on Kansas, and how it has shifted from 5% more republican than the rest of the country, to reliably 25%+ more republican than the U.S. as a whole.
In contrast to the previous two states I've analyzed, Kansas clearly and definitively departed the "swing state" zone a long time ago. It's probable that neither party bothered to mount much of a campaign, causing Kansas to quickly shift to some kind of "natural state", the way it votes for president when it isn't a focus for both campaigns. And for Kansas, that natural state seems to be solid red.

Thursday, July 9, 2015

Pennsylvania in presidential politics

This is the next post in our series, "How are the swing states doing anyway?" Next up, we have Pennsylvania, which has been consistently just a little more democratic than the nation as a whole:

It has jumped around a little bit, so it's hard to discern any real trend other than "probably steady". Quantitatively this translates into our 2016 prediction: Pennsylvania will probably be around 2.6% more democratic than the rest of the nation (68% chance for a democratic advantage between 1.15-4.05%, with large assumptions including a straight-line fit through the historic dem advantage).

Without a clear trend, I won't even try to come up with any kind of guess about what demographic, political, or economic events could have been causing these observed numbers.

Once I complete this kind of analysis for all of the swingier states, I'll be able to construct a model predicting which states are likely to be the tipping point states, and what kind of national vote totals will translate into an electoral college win on either side.

Monday, July 6, 2015

Virginia in presidential politics

I love projecting presidential elections way too early, so obviously it's time to start predicting for the 2016 Big Game!

Today, I wanted to talk specifically about Virginia. Until recently, Virginia has been considered "safely" Republican during the presidential election - even if you count 2008, when Barack Obama won the state. What do I mean?

Let's go back to 2008, when Barack Obama won Virginia by a 6.3% margin, while winning the US popular vote as a whole by 7.3%. Now let's say we adjust our magical "popular vote" dial, reducing the democrat's share of the popular vote equally among all the states. The first state to flip to the republicans would be North Carolina. Then Indiana, Florida, Ohio, and then Virginia, at which point John McCain would still have been 11 electoral votes shy of winning. On top of all those states, he would also have needed to flip Colorado and finally Iowa, which would have been unlikely if he hadn't ALREADY won Virginia. So, for Obama, Virginia was unnecessary to his win, and for McCain, winning Virginia would be a given if he had carried Colorado and Iowa, which would have been required to win the election. Let's use Nate Silver's terminology and designate Iowa the "Tipping Point State" for 2008. Under that model, either candidate just has to win Iowa and all the states on their side of Iowa, assuming each state has a reasonably similar per-capita elasticity (voter response to campaign activity) and each campaign has pretty good knowledge of current polling in each state. How will each state change with respect to the national average? Let's zoom in on Virginia:


In the graph above I've plotted Virginia's Democratic (2-party share) vote margin for the past seven presidential elections. Although the national and statewide margins bounce around chaotically, by looking at the difference ("how republican Virginia is compared to the nation as a whole"), we can see that Virginia has slowly but clearly been drifting away from Republicans since 1988, culminating (so far) in the 2012 election, when it had essentially the same vote margin as the nation as a whole. Based on a simple linear fit, I predict that in 2016, the democrat will get a higher margin in Virginia than nationwide, by about 2%, for the first time since FDR. That means that even if the Republican gets 51.00% of the national popular vote, they'd still lose Virginia.

[Update: the error bars show +/- one standard deviation from the linear model. In other words, if all my assumptions are true, there is a 68% chance that Virginia in 2016 will fall between the two error bars, and be somewhere between 0.8% and 3.3% more democratic than the country as a whole.]

I'm sure there are numerous expensive demographic studies out there detailing exactly why Virginia is drifting from right to center ... so does anyone want to trudge through them for me? My guesses at the moment:
1) growth in the DC suburbs and exburbs,
2) more generally, increasing urbanization throughout the state, and
3) a growing young and minority population, which is disproportionately happening in Virginia.

I hope to complete a similar analysis for all of the so-called "battleground" states, and calculate a prediction of the systematic advantage the democrat or republican has going into the election. I'd be so excited if the democrat won the electoral college but lost the popular vote; then we might finally see some bipartisan reform to the current broken electoral college system!

Friday, February 13, 2015

In defense of drinking milk


A hilariously inept article on why "adults should not be drinking milk" has inspired me to incompetently defend the vulgar and glorious drink I love so much. Full disclosure: I drink milk every day, I always have milk when I eat sweet starchy foods (cake, cookies, pancakes), and nothing will stop me from drinking milk.

Let me dissect this article point-by-point so that I might respond:

No other species can digest milk after babyhood.

There are plenty of things I'm going to keep doing, even though no other species can do it. Speak. Use modern medicine. Participate in a society. Develop and use tools. Kara Brown is free to eschew these things if she wants, although her picture shows her - gasp - wearing clothes! No other species can do that!
KaraBrown


Fewer than 40 percent of humans on earth can digest lactose post-childhood, and only 5 percent of Asians and 25 percent of African adults can properly digest milk. In case you're keeping score at home, those continents have most of the humans we got.
No one is trying to force lactose-intolerant people to drink milk. But just because a slim majority of adult humans can't digest milk, I should stop drinking - why? Out of solidarity? Will that help those poor unfortunate souls?
You know what the number one killer of adults in America is? Goddamn heart disease. If you enjoy living, put the milk down.

The average American drinks 44 gallons per year of soda, compared to 20.4 gallons of milk. I'll concede it possible that, for an adult with a healthy diet, milk is a less-healthy choice than water. But often it's replacing soda or juice. On top of that, many people choose low-fat or skim milk.

Point: You can get calcium from plenty of other foods.

True. For most adults I believe you can get a healthy amount of calcium from a well-planned  dairy-free diet. So if you're eating plenty of spinach, kale, collards, or okra every day, then you're getting enough calcium. Everyone else should consider having some cheese or milk occasionally.

Point: It's gross.


I love the mental image Kara Brown must have of people like me. Cut to a black-and-white scene of me sitting in the dark, alone in a large unfurnished room, pouring a big glass of milk with a look of dread. "Milk is so gross, I hate it. But I - must - drink it for some reason! Why oh why is the world like this?" In reality, those of us who drink milk do it because - news flash - we LIKE it. We don't think it's gross.

Monday, January 12, 2015

Switching from iPhone? Apple will ruin your life.

If you're thinking of buying an iPhone, here's a compelling reason not to. If you switch from an iphone to another kind of phone, apple will block all iphones from sending you text messages. This is similar to how Islam and other religions treat apostasy: with harsh penalties ranging from excommunication to death. Apple is the Saudi Arabia of tech companies.

The story:

I bought an iPhone early last year, but after it constantly did its best to enrage me at every opportunity, I switched to a non-i phone. After I switched, I eventually was fortunate enough to discover that apple was blocking text messages from other iphone users to my phone number, without notifying them or me. Many messages are still being blocked, months later, even after I called apple and asked them to fix it.

Here's how the "bug" works (they claim it's a bug although it's obviously intentional): When you open a new text message conversation on your iphone, iMessage checks its database to see whether the recipient is an iphone, and therefore eligible to receive an iMessage. To save money, apple cuts corners and sends an iMessage instead of an actual sms, which uses a different cellular network. If the iphone routes the message through iMessage, but the recipient doesn't use an iphone any more, then iMessage just gives up. But it doesn't tell the sender or recipient that there was an error. It tells the sender that their message was successfully sent, but does not actually send the message.

So if someone had sent me a message like this one: "Hey Forrest. I'm going through a rough time and I really need someone to talk to. Please give me a call" then I wouldn't have received it, but they would be told I received it, and they would assume I don't care enough to respond. If someone had sent me a message like this one: "Hey Forrest, your mom is in the hospital. Please come quickly" I wouldn't have received it.

When you switch from an iphone, apple assumes that someone will somehow tell iMessage that your phone number should be taken off the list - but they don't do it themselves! Their plan is to wait until you somehow figure out that that your personal communications are being blocked, search the internet for a bunch of possible solutions, and then finally discover the little known secret of deregistering your phone number from iMessage. But until recently there was no way to do this, so every message from an iphone to a previously-iphone number was just blocked. Apple received so many complaints about this issue that they finally made a website to deregister your phone number from iMessage. But there's a massive flaw in their "fix". If someone with an iphone has a conversation already open with you, it won't check again with iMessage whether the phone number is registered, so any new messages within that conversation will still not actually be sent to you. After struggling for an hour with apple tech support, I discovered that the only way to fix this is to call all of your friends and family, and tell them to delete all of their conversations with you. I hope if you do that, you'll also tell them how vindictive, greedy, and incompetent apple is, and urge them never to purchase an apple product or service again. Presumably a cackling undead Steve Jobs collects all the phone numbers that people submit on that website to sell to telemarketers, spammers, and al-Qaeda

I'm not an apple customer but I spent an hour today trying - and failing - to get apple to stop blocking personal text messages that my friends and family send me. Apple has programmed all its iphones to shun any apostates who leave the cult of iPhone.

[Update 1/12/2015] One day after I called and asked them to fix it, the "genius" at apple confirmed that there's nothing they can do. He repeated that the only way they could come up with to fix this problem is to call all of my friends, family, and coworkers, and tell them to ditch their iphones delete their conversations with me. To be clear, apple is intercepting and blocking personal text messages, and has refused to stop.